- Research
- Open access
- Published:
Synchronization clusters located on epileptic onset zones in neocortical epilepsy
Acta Epileptologica volume 4, Article number: 42 (2022)
Abstract
Background
Brain function is thought to rely on complex interactions of dynamic neural systems, which depend on the integrity of structural and functional networks. Focal epilepsy is considered to result from excessive focal synchronization in the network. Synchronization analysis of multichannel electrocorticography (ECoG) contributes to the understanding of and orientation of epilepsy. The aim of this study was to explore the synchronization in multichannel ECoG recordings from patients with neocortical epilepsy and characterize neural activity inside and outside the onset zone.
Methods
Four patients with neocortical epilepsy, who became seizure-free for more than 1 year after surgery guided by ECoG monitoring, were included in this study. ECoG data recorded during pre-surgical evaluation were analyzed. Synchronizations in phase and amplitude of different frequency bands between ECoG channels was analyzed using MATLAB. We generated 100 surrogate data from the original ECoG data using Amplitude Adjusted Fourier Transform to calculate the enhanced synchronization. The relationship between synchronization characteristics and seizure onset zone was analyzed.
Results
We found synchronization clusters in the 14–30 Hz and 30–80 Hz bands around the onset areas during both interictal and the beginning of ictal periods in all four patients.
Conclusions
The enhanced-synchronization clusters play a central role in epilepsy, and may activate the onset areas and contribute to the spreading of epileptiform activity.
Background
Brain function is thought to rely on complex interactions of dynamic neural systems, which depend on the integrity of structural and functional networks [1, 2]. Epilepsy is a network disease and epileptogenic networks are the brain regions involved in the production and propagation of epileptic activities [3,4,5]. Studies on functional and structural networks in epilepsy have revealed specific disruptions in the connectivity and brain networks [6, 7]. Excessive synchronization of a large number of neuronal populations is the main cause of epilepsy [8, 9]. Electrical activity recorded by electrocorticography (ECoG) can provide continuous information on intracortical interactions [10]. Phase synchronization analysis has been demonstrated useful for inferring functional connectivity using multichannel electroencephalograph (EEG) [11,12,13]. One study using functional magnetic resonance imaging (MRI) showed that the phase-synchronization clusters have a common neuroanatomical basis [14]. Phase synchronization analysis showed significant decreases/increases of the local/global efficiency in δ-β, δ-α, θ-α and δ-θ bands in the cross-frequency coupling network, and a significant decrease in the local efficiency in α and θ bands of the within-frequency coupling network. The frequency coupling may provide a new perspective to investigate alterations of brain structure during a seizure [15]. Amplitude is another important information in EEG. In this study, we set out to analyze phase and amplitude synchronization of multichannel ECoG recordings in patients with neocortical epilepsy.
Matierials and methods
Patient selection
ECoG was recorded at a sampling rate of 1600 Hz from 15 patients implanted with subdural electrodes for epilepsy surgery evaluation at our epilepsy center. Four patients with normal MRI were verified to be neocortical epilepsy by ECoG analysis, and were seizure-free for more than 1 year after the surgery. Other patients were excluded from the study because of the non-neocortical type of epilepsy or that they still had seizures after the operation. The study was approved by the ethics committee of Xuanwu Hospital, Capital Medical University and all the patients signed informed consent.
ECoG recordings
Subdural implantation of stainless electrodes was performed according to the seizure semiology and scalp EEG recording, with a distance of 10 mm between the electrode centers. The onset zone and area for resection were determined based on ECoG recording.
ECoG was recorded using a 128-channel Grass/Twins monitoring system (Grass Technologies, West Warwick, USA) at the sampling rate of 1600 Hz, with a low-frequency cutoff of 0.1 Hz and a high-frequency cutoff of 500 Hz. We selected 3 min of interictal ECoG activity during wakefulness and 5–10 seconds of the beginning of ictal ECoG for analysis. ECoG data were transformed into European Data Format and analyzed using MATLAB software (MathWorks, Natick, USA).
Synchronization analysis
The steps of ECoG synchronization analysis are as follows.
-
1)
Signals were separated into the following frequency bands: 0–4 Hz, 4–8 Hz, 8–14 Hz, 14–30 Hz, 30–80 Hz and 80–160 Hz, using two-way least-squares finite impulse response band-pass filters.
-
2)
We used the Hilbert transform to calculate the phase and amplitude for all channels.
Let x(t) be the ECoG signal in a certain frequency band at time t, and let y(t) be the Hilbert transformation of x(t). The instantaneous phase was calculated as:
The instantaneous amplitude was calculated as:
-
3)
The phase difference between different channels was calculated as:
-
4)
The phase- and amplitude-synchronization indices between different channels were calculated using the following formulas:
phase-synchronization index:
and amplitude-synchronization index:
Then the two indices were combined into the integrated synchronization index as follows:
-
5)
We composed synchronization matrices using the integrated synchronization indices of each channel pair:
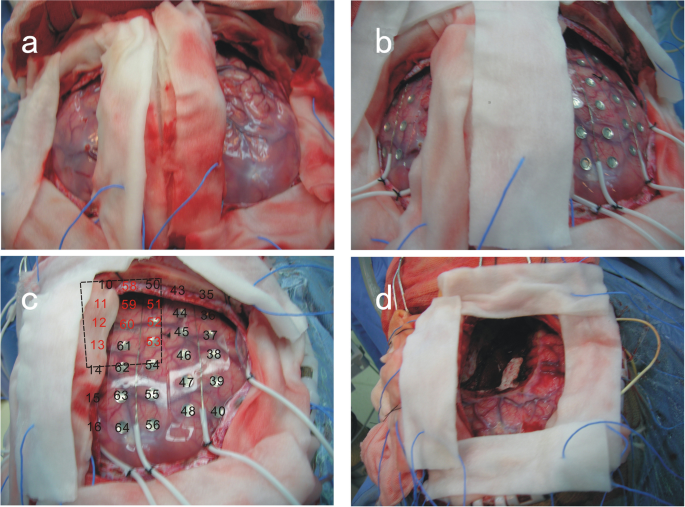
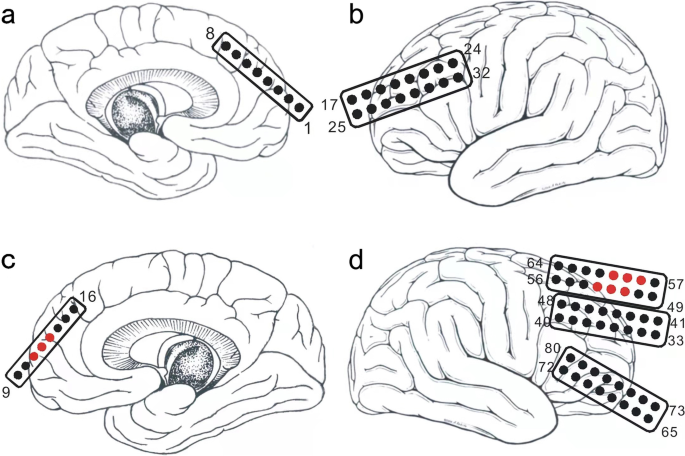
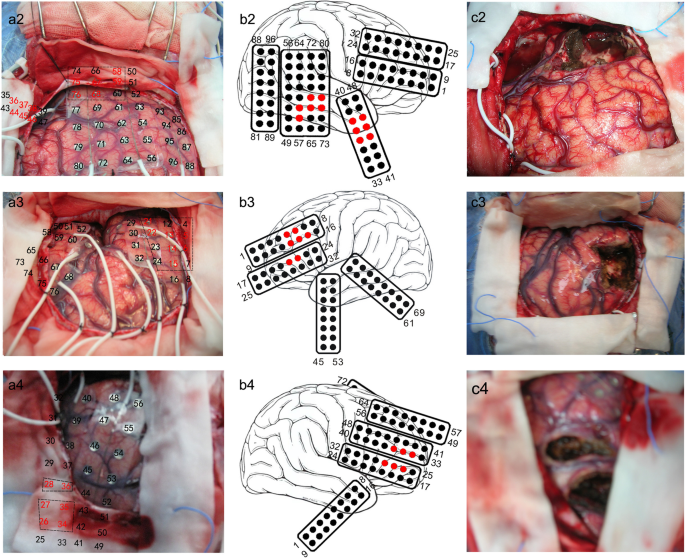
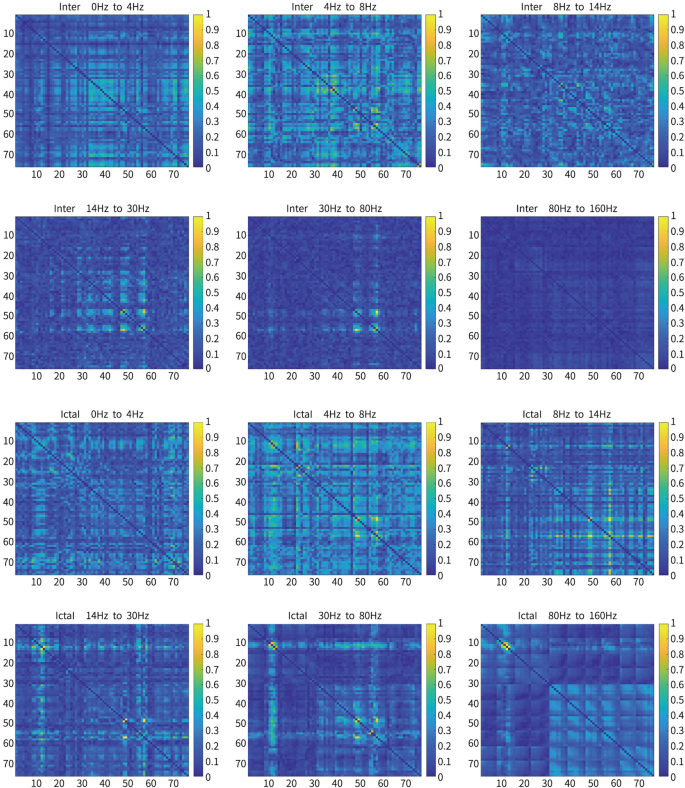
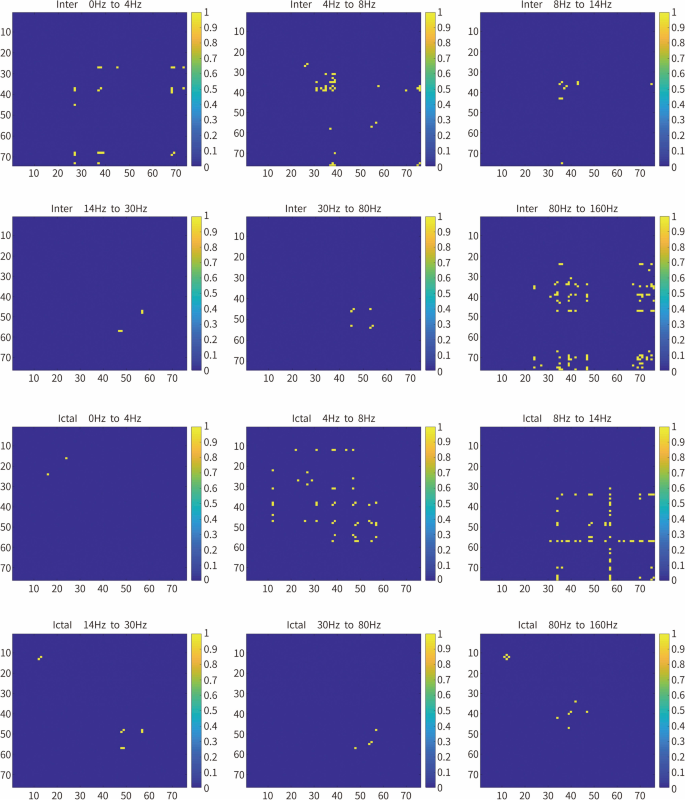
Illustrations of implanted electrodes and sites of resection are shown in Figs. 1, 2 and 3. An example of synchronization matrices and enhanced synchronization matrices for different frequency bands for patient 1 is shown in Figs. 4 and 5.
Criteria for enhanced synchronization
We generated 100 surrogate data from the original ECoG data using Amplitude Adjusted Fourier Transform [16, 17], which attempts to preserve both the linear structure and the amplitude distribution. This method consists of the following steps:
-
(1)
scaling the data to a Gaussian distribution (Gaussianization);
-
(2)
performing a random permutation transformation to the generated data;
-
(3)
inverse transformation of data in the first step (de-Gaussianization).
Then IAPSI matrix was calculated from each surrogate data. The mean and standard deviation (denoted as \(\overline{sIAPSI}\) and δ) of the surrogate IAPSI matrices (sIASPI) were derived in all time windows to calculate the enhanced synchronization (ES):
and K = 5.
The enhanced synchronization matrices of different frequency bands for patient 1 are shown in Fig. 5.
Symbol glossary in the above equations are as follows: i, j, a pair of channels (electrodes); t, time; n, total number of channels; PSI, matrix of phase synchronization for all channel pairs; M, the total number of data points in each epoch; APSI, matrix of amplitude synchronization for all channel pairs; IAPSI, matrix of integrated synchronization for all channel pairs.
Results
In patient 1, we found cluster synchronization around the seizure onset zone in the 14–30 Hz and 30–80 Hz frequency bands during interictal and ictal periods. Cluster synchronization refers to the phenomenon that clusters reach synchronization and the synchronization states are necessarily different from other areas [18, 19]. During the interictal period, synchronization clusters were found around the onset zones in the 14–30 Hz and 30–80 Hz bands in the four patients. During the ictal period, synchronization clusters were found to cover the onset areas in the 8–14 Hz, 14–30 Hz, and 30–80 Hz bands. We also found synchronization clusters in the 80–160 Hz band at the onset areas during interictal and ictal periods in two of the four patients.
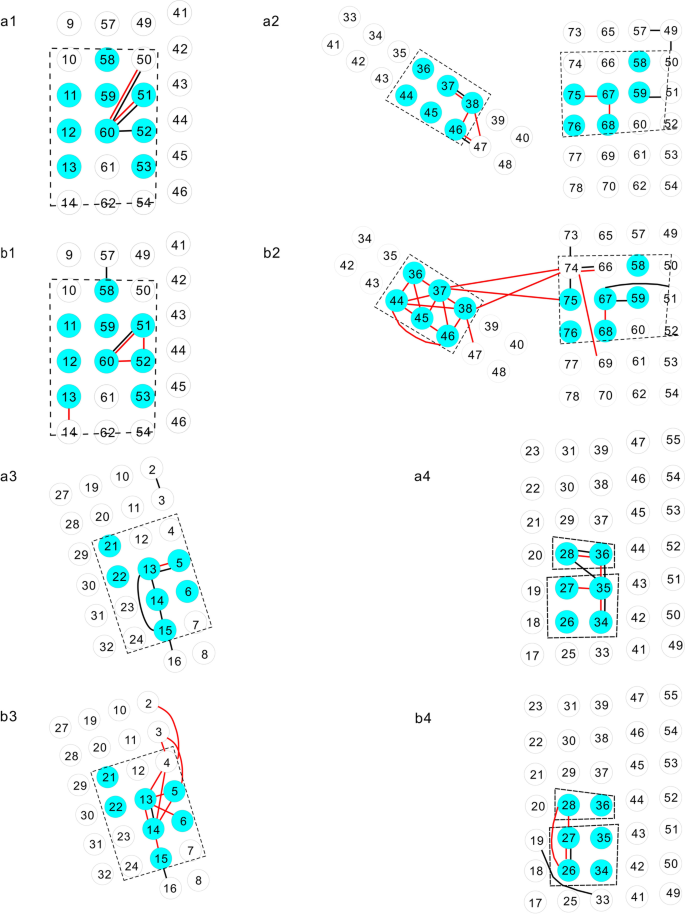
Figure 6 shows the diagrams of enhanced synchronization clusters and seizure onset zones in the 14–30 Hz and 30–80 Hz bands of the four patients. About 66.7–100% of the electrodes related to interictal enhanced synchronization and 60–82% of the electrodes related to ictal enhanced synchronization were resected. The enhanced synchronization clusters were around the seizure onset zones and the cores of synchronization clusters were resected during the surgery.
Diagrams showing electrodes with enhanced synchronization (a Interictal stage, b Ictal stage; number 1–4 represent the patients 1–4. Blue circles indicate electrodes over the onset areas; solid red and black lines indicate enhanced synchronization in the 14–30 Hz and 30–80 Hz bands, respectively. Dashed black lines delineate resected areas during surgery)
Discussion
Interactions and coordinated activity between neurons and neuronal populations are the foundations of brain function [20]. In this study, we calculated phase and amplitude synchronization and found synchronized clusters (14–30 Hz and 30–80 Hz) in both interictal and ictal ECoG in four patients with focal neocortical epilepsy. This result was partly in accordance with another study which showed different connectivity patterns, mainly in the gamma band, between epileptogenic zones and other cortical areas [21].
Focal epilepsy was thought to be a result of excessive focal synchronization [21] followed by the spread of excitation to other areas. In patient 3, the enhanced synchronized network was found to be located not only under electrodes adjacent to the onset zone but also under distant electrodes. The two synchronized areas were connected during the ictal period. When 66.7–100% of the electrodes related to the interictal enhanced synchronization and 60–82% of the electrodes related to the ictal enhanced synchronization were resected, the patients were seizure free after the surgery. However, as shown in Fig. 6, the electrodes related to enhanced synchronization were near the resected area.
The synchronization analysis of these four patients reflected the networks during the interictal and ictal periods [22]. The synchronized clusters might be caused by the increased coupling of neuronal activity [23]. We propose that the synchronization cluster area was the core or the hub of epilepsy network, which could activate the onset area to induce seizures [15]. The cores are the regions that have very high connectivity with other parts of the cortex and may be the target for resection in epilepsy surgery [24, 25].
However, there are some limitations in our study. First, we only studied the synchronization in 4 patients who met the clinical and ECoG criteria. Second, the result of synchronized network depends on the selection of area for ECoG as we could not record the ECoG of the whole cortex. Third, the patients who still suffered seizures after the surgery were excluded from this study because we did not know the exact onset zone in these patients. Future studies should be performed to analyze the synchronization in patients who are seizure free after a second surgery and compare the synchronization results with the results from seizure-free patients after one surgery.
Conclusions
The neural activity in seizure onset zones was hypersynchronized during not only ictal but also interictal periods. The enhanced synchronization clusters in beta and gamma bands are located around the seizure onset zones during interictal and ictal periods. The results suggest that the areas of enhanced synchronization clusters play a central role in epilepsy and may activate the onset zone and contribute to the spreading of epileptiform activity [26, 27]. The cores of synchronized network are potential targets for resection.
Availability of data and materials
The datasets generated in this study are available from the corresponding author on reasonable request.
Abbreviations
- ECoG:
-
Electrocorticography
- EEG:
-
Electroencephalograph
- MRI:
-
Magnetic resonance imaging
- SEEG:
-
Stereo-electroencephalograph
References
Van Diessen E, Diederen SJ, Braun KP, Jansen FE, Stam CJ. Functional and structural brain networks in epilepsy: what have we learned? Epilepsia. 2013;54(11):1855–65.
Kazemi S, Jamali Y. Phase synchronization and measure of criticality in a network of neural mass models. Sci Rep. 2022;2(1):1319.
Bartolomei F, Trébuchon A, Bonini F, Lambert I, Gavaret M, Woodman M, et al. What is the concordance between the seizure onset zone and the irritative zone? A SEEG quantified study. Clin Neurophysiol. 2016;127(2):1157–62.
Lian J, Shuai J, Hahn P, Durand DM. Nonlinear dynamic properties of low calcium-induced epileptiform activity. Brain Res. 2001;890(2):246–54.
Hassan M, Merlet I, Mheich A, Kabbara A, Biraben A, Nica A, et al. Identification of Interictal epileptic networks from dense-EEG. Brain Topogr. 2017;30(1):60–76.
Hu S, Chi J, Zhang J, Kong W, Cao Y, He B. Increase trend of correlation and phase synchrony of microwire iEEG before macroseizure onset. Cogn Neurodyn. 2014;8(2):111–26.
Jiruska P, de Curtis M, Jefferys JG, Schevon CA, Schiff SG, Schindler K. Synchronization and desynchronization in epilepsy: controversies and hypotheses. J Physiol. 2013;591(4):787–97.
Dominguez LG, Wennberg RA, Gaetz W. Enhanced synchrony in Epileptiform activity? Local versus distant phase synchronization in generalized seizures. J Neurosci. 2005;25(35):8077–84.
Liu J, Baraban SC. Network properties revealed during multi-scale calcium imaging of seizure activity in Zebrafish. eNeur. 2019;6(1):1–13.
Ortega GJ, Menendez de la Prida L, Sola RG, Pastor J. Synchronization clusters of interictal activity in the lateral temporal cortex of epileptic patients: l intraoperative electrocorticographic analysis. Epilepsia. 2008;49(2):269–80.
Sun J, Hong X, Tong S. Phase synchronization analysis of EEG signals: an evaluation based on surrogate tests. IEEE Trans Biomed Eng. 2012;59(8):2254–6.
Sakkalis V. Review of advanced techniques for the estimation of brain connectivity measured with EEG/MEG. Comput Biol Med. 2011;41(12):1110–7.
Rangaprakash D. Connectivity analysis of multichannel EEG signals using recurrence based phase synchronization technique. Comput Biol Med. 2014;46:11–21.
Gravel N, Harvey BM, Renken RJ, Dumoulin SO, Cornelissen FW. Phase-synchronization-based parcellation of resting state fMRI signals reveals topographically organized clusters in early visual cortex. Neuroimage. 2018;170:424–33.
Haitao Y, Zhu L, Cai L, Wang J, Liu C, Shi N, et al. Variation of functional brain connectivity in epileptic seizures: an EEG analysis with cross-frequency phase synchronization. Cogn Neurodyn. 2020;14(1):35–49.
Theiler J, Prichard D. Constrained-realization Monte-Carlo method for hypothesis testing. Physica D. 1996;94:221–35.
Theiler J, Eubank S, Longtin A, Galdrikian B, Doyne J. Testing for nonlinearity in time series: the method of surrogate data. Physica D. 1992;58:77–94.
Yang S, Cheng H, Juan Y, Jiang H. Finite-time cluster synchronization in complex-variable networks with fractional-order and nonlinear coupling. Neural Netw. 2021;135:212–24.
Wang K, Xinchu F, Li K. Cluster synchronization in community networks with nonidentical nodes. Chaos. 2009;19(2):023106.
Schiff SJ, So P, Chang T, Burke RE, Sauer T. Detecting dynamical interdependence and generalized synchrony through mutual prediction in a neural ensemble. Physiol Rev. 1996;54(6):6708–24.
Varotto G, Tassi L, Franceschetti S, Spreafico R, Panzica F. Epileptogenic networks of type II focal cortical dysplasia: a stereo-EEG study. NeuroImage. 2012;61(3):591–8.
Meesters S, Ossenblok P, Colon A, Wagner L, Schijns O, Boon P, et al. Modeling of intracerebral interictal epileptic discharges: evidence for network interactions. Clin Neurophysiol. 2018;129(6):1276–90.
Sheybani L, Mégevand P, Spinelli L, Bénar CG, Momjian S, Seeck M, et al. Slow oscillations open susceptible time windows for epileptic discharges. Epilepsia. 2021;62(10):2357–71.
Royer J, Bernhardt BC, Larivière S, Gleichgerrcht E, Vorderwülbecke BJ, Vulliémoz S, et al. Epilepsy and brain network hubs. Epilepsia. 2022;63(3):537–50.
Geier C, Bialonski S, Elger CE, Lehnertz K. How important is the seizure onset zone for seizure dynamics? Seizure. 2015;25:160–6.
Bartolomei F, Lagarde S, Wendling F, McGonigal A, Jirsa V, Guye M, et al. Defining epileptogenic networks: contribution of SEEG and signal analysis. Epilepsia. 2017;58(7):1131–47.
Lin Y, Wang Y. Neurostimulation as a promising epilepsy therapy. Epilepsia Open. 2017;58(7):371–87.
Acknowledgements
Not applicable.
Funding
This research was supported by the National Natural Science Foundation of China (82071453, 81771398), Beijing Municipal Science and Technology Commission (Z121107001012007) and Qingdao Municipal Science and Technology Bureau in China (15–9–2-85-nsh).
Author information
Authors and Affiliations
Contributions
Acquisition of data: Yanping Sun, Yuqiang Song, Hongjin Ren, Haifang Zhu, Wenjing Yan, Xiaoli Li,Yuping Wang. Drafting of the manuscript: Yanping Sun, Yanning Wang, Hongjin Ren. All authors read and approved the final manuscript.
Corresponding author
Ethics declarations
Ethics approval and consent to participate
The study was approved by the Research Ethics Committee of Xuanwu Hospital, Capital Medical University (2017–086) and all patients signed informed consent.
Consent for publication
Not applicable.
Competing interests
Corresponding author Yuping Wang is the editorial board member for Acta Epileptologica, who was not involved in the journal’s review of, or decisions related to this manuscript.
Rights and permissions
Open Access This article is licensed under a Creative Commons Attribution 4.0 International License, which permits use, sharing, adaptation, distribution and reproduction in any medium or format, as long as you give appropriate credit to the original author(s) and the source, provide a link to the Creative Commons licence, and indicate if changes were made. The images or other third party material in this article are included in the article's Creative Commons licence, unless indicated otherwise in a credit line to the material. If material is not included in the article's Creative Commons licence and your intended use is not permitted by statutory regulation or exceeds the permitted use, you will need to obtain permission directly from the copyright holder. To view a copy of this licence, visit http://creativecommons.org/licenses/by/4.0/.
About this article
Cite this article
Sun, Y., Song, Y., Ren, H. et al. Synchronization clusters located on epileptic onset zones in neocortical epilepsy. Acta Epileptologica 4, 42 (2022). https://doi.org/10.1186/s42494-022-00113-0
Received:
Accepted:
Published:
DOI: https://doi.org/10.1186/s42494-022-00113-0
